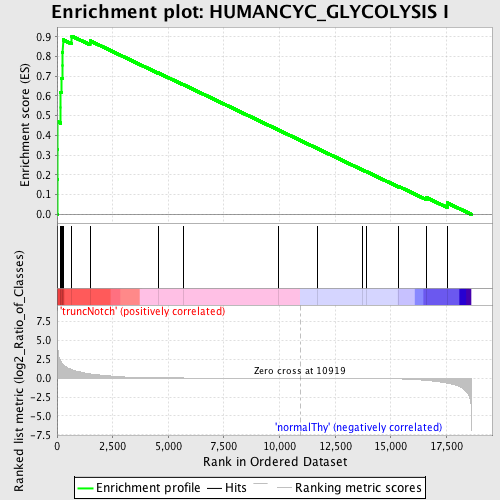
Profile of the Running ES Score & Positions of GeneSet Members on the Rank Ordered List
| Dataset | Set_03_truncNotch_versus_normalThy.phenotype_truncNotch_versus_normalThy.cls #truncNotch_versus_normalThy.phenotype_truncNotch_versus_normalThy.cls #truncNotch_versus_normalThy_repos |
| Phenotype | phenotype_truncNotch_versus_normalThy.cls#truncNotch_versus_normalThy_repos |
| Upregulated in class | truncNotch |
| GeneSet | HUMANCYC_GLYCOLYSIS I |
| Enrichment Score (ES) | 0.90346867 |
| Normalized Enrichment Score (NES) | 1.6134906 |
| Nominal p-value | 0.001776199 |
| FDR q-value | 0.028410798 |
| FWER p-Value | 0.321 |
| PROBE | DESCRIPTION (from dataset) | GENE SYMBOL | GENE_TITLE | RANK IN GENE LIST | RANK METRIC SCORE | RUNNING ES | CORE ENRICHMENT | |
|---|---|---|---|---|---|---|---|---|
| 1 | PGK1 | 1570494 630300 | 11 | 5.024 | 0.1786 | Yes | ||
| 2 | TPI1 | 1500215 2100154 | 25 | 4.295 | 0.3311 | Yes | ||
| 3 | PFKM | 1990156 5720168 | 34 | 3.868 | 0.4686 | Yes | ||
| 4 | PKM2 | 6520403 70500 | 160 | 2.217 | 0.5410 | Yes | ||
| 5 | ENO1 | 5340128 | 161 | 2.215 | 0.6200 | Yes | ||
| 6 | ENO3 | 5270136 | 198 | 2.033 | 0.6906 | Yes | ||
| 7 | FBP1 | 1470762 | 240 | 1.886 | 0.7556 | Yes | ||
| 8 | ALDOA | 6290672 | 242 | 1.875 | 0.8224 | Yes | ||
| 9 | PGAM2 | 3610605 | 264 | 1.791 | 0.8852 | Yes | ||
| 10 | PFKL | 6200167 | 661 | 1.110 | 0.9035 | Yes | ||
| 11 | PGAM1 | 2570133 | 1480 | 0.571 | 0.8799 | No | ||
| 12 | GAPDHS | 2690463 | 4537 | 0.054 | 0.7175 | No | ||
| 13 | FBP2 | 1580193 | 5674 | 0.029 | 0.6574 | No | ||
| 14 | PKLR | 1170400 2470114 | 9933 | 0.003 | 0.4285 | No | ||
| 15 | ALDOB | 4730324 | 11700 | -0.002 | 0.3337 | No | ||
| 16 | PGK2 | 2650091 | 13736 | -0.015 | 0.2248 | No | ||
| 17 | ALDOC | 450121 610427 | 13898 | -0.017 | 0.2167 | No | ||
| 18 | BPGM | 5080520 | 15363 | -0.087 | 0.1411 | No | ||
| 19 | ENO2 | 2320068 | 16609 | -0.296 | 0.0847 | No | ||
| 20 | PFKP | 70138 6760040 1170278 | 17534 | -0.650 | 0.0582 | No |

